

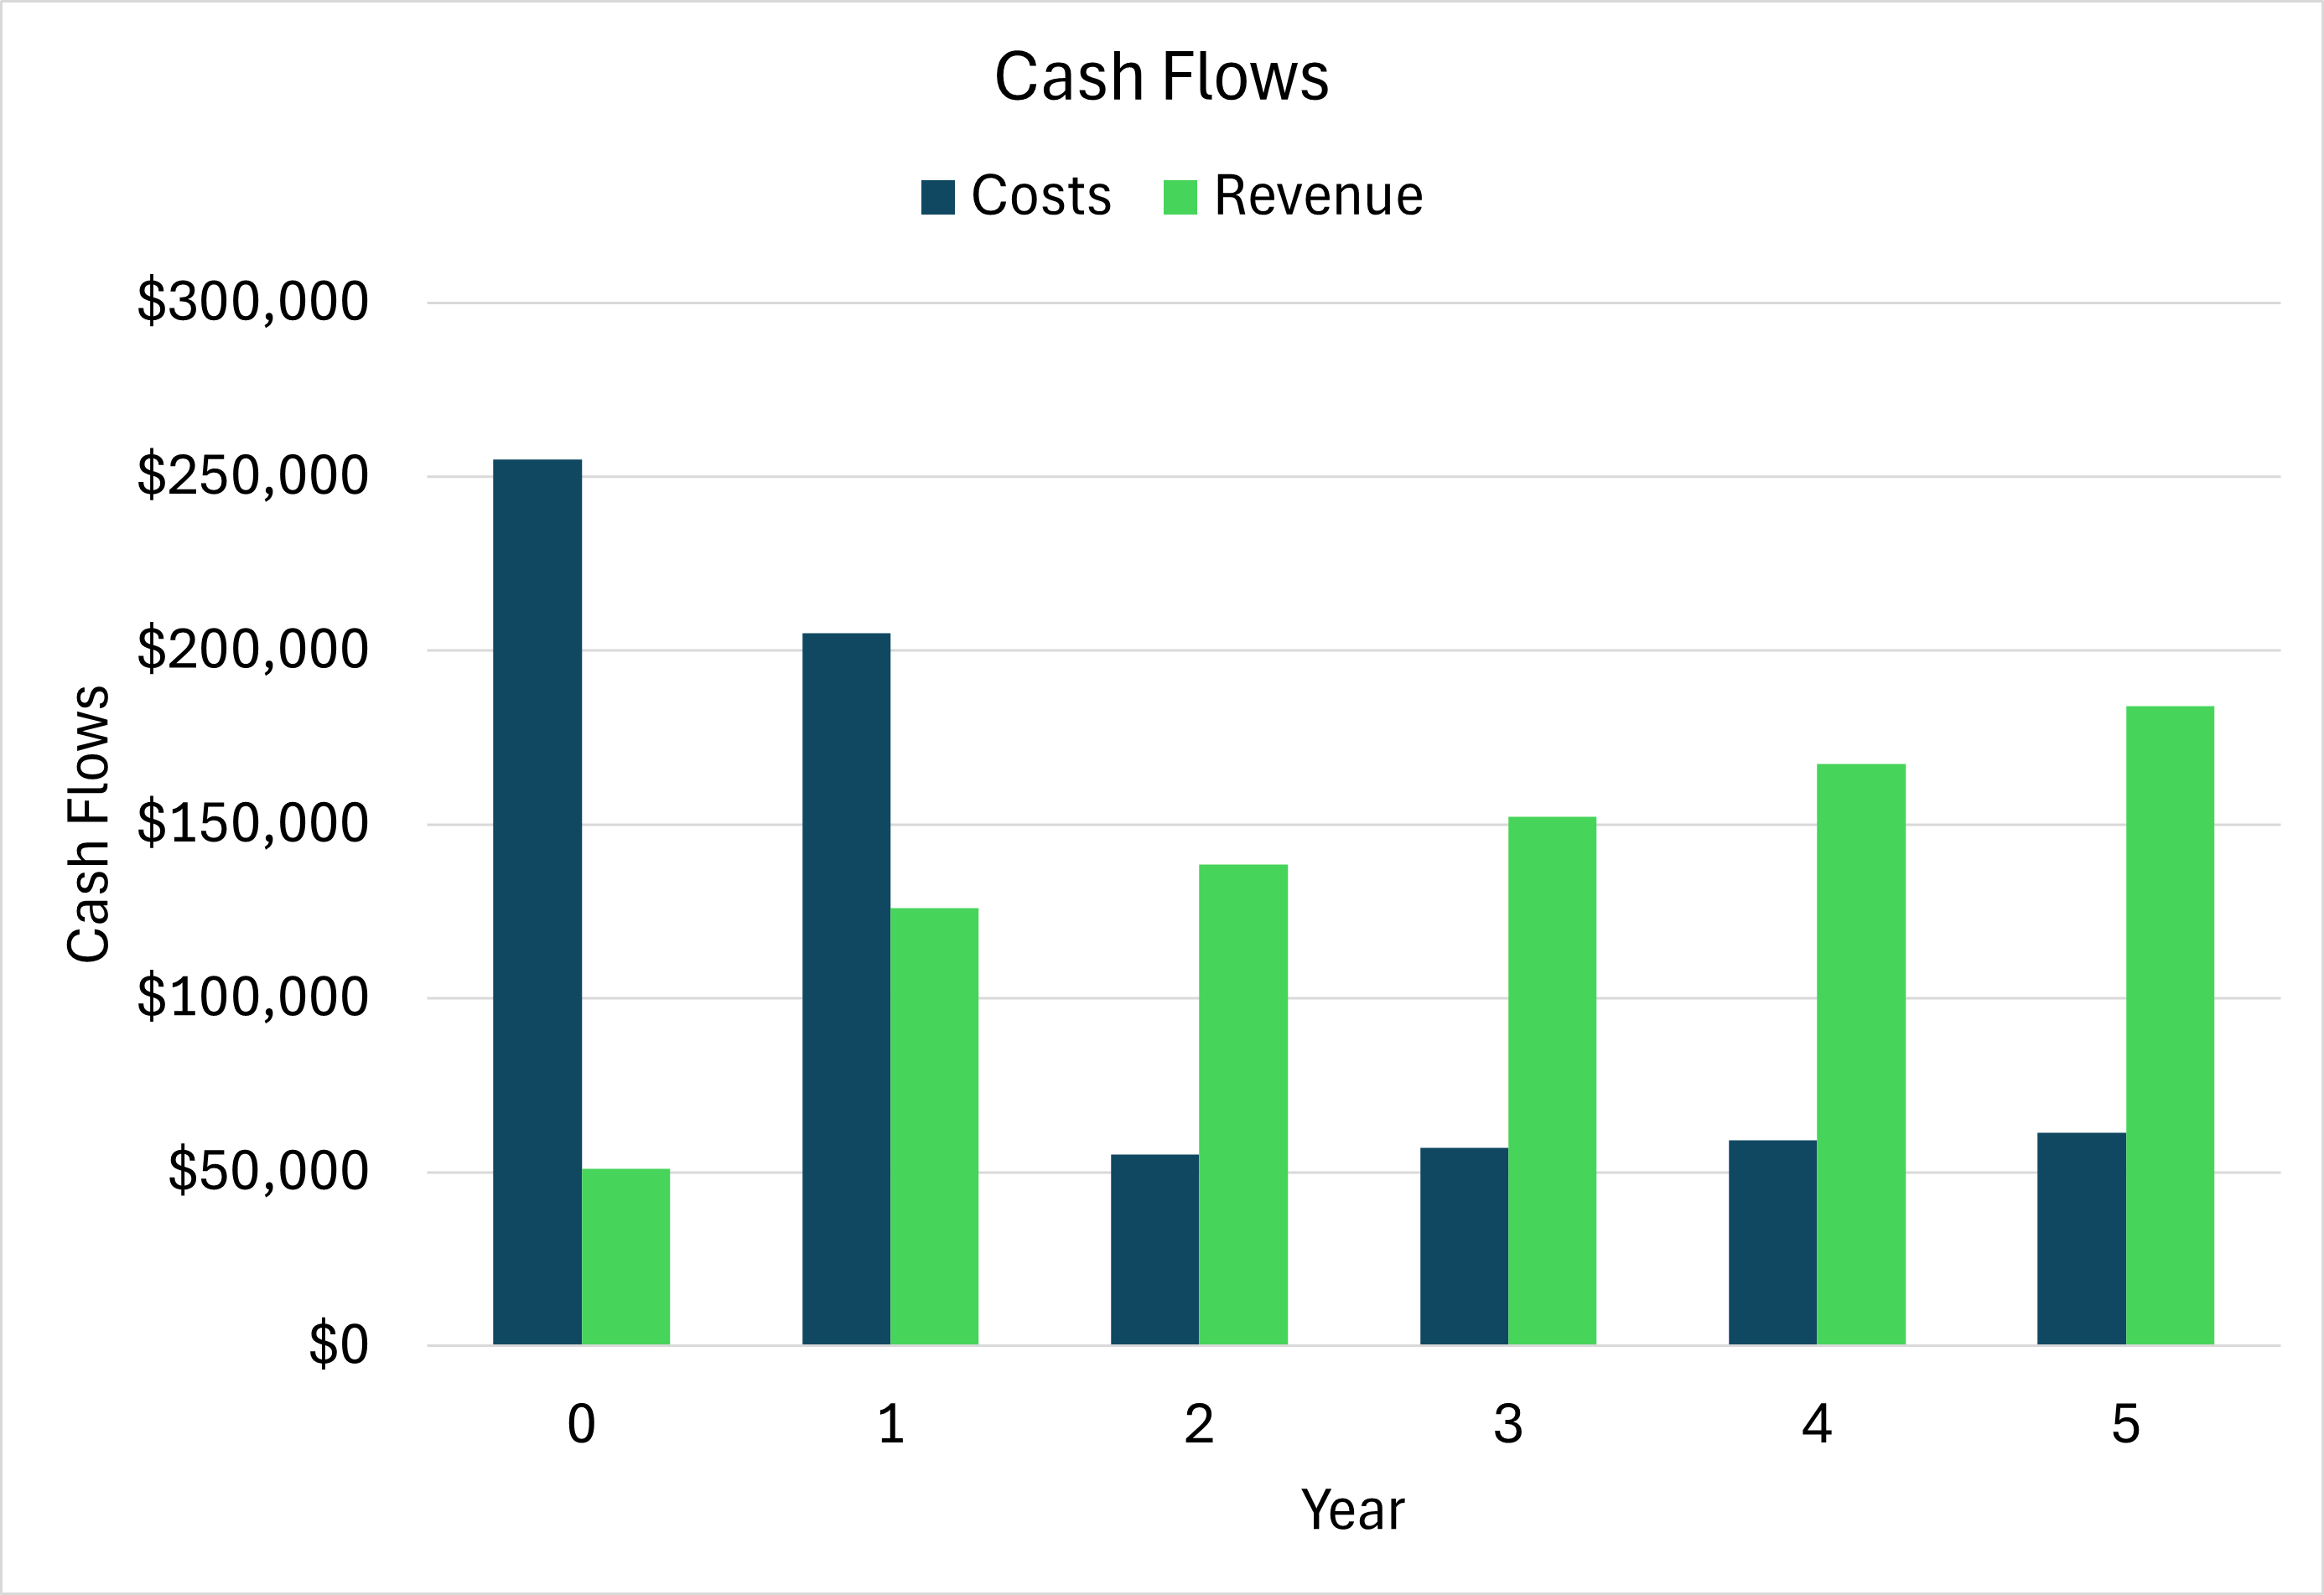
Automated charts to visualize data
Automatically create beautiful charts to visualize long term cash flows. Ready to share with your team and to your boss.
Detailed financial analysis with practical tips
Template to organize your calculations and churn them into actionable insights. Break down costs and get tips on what it all means.
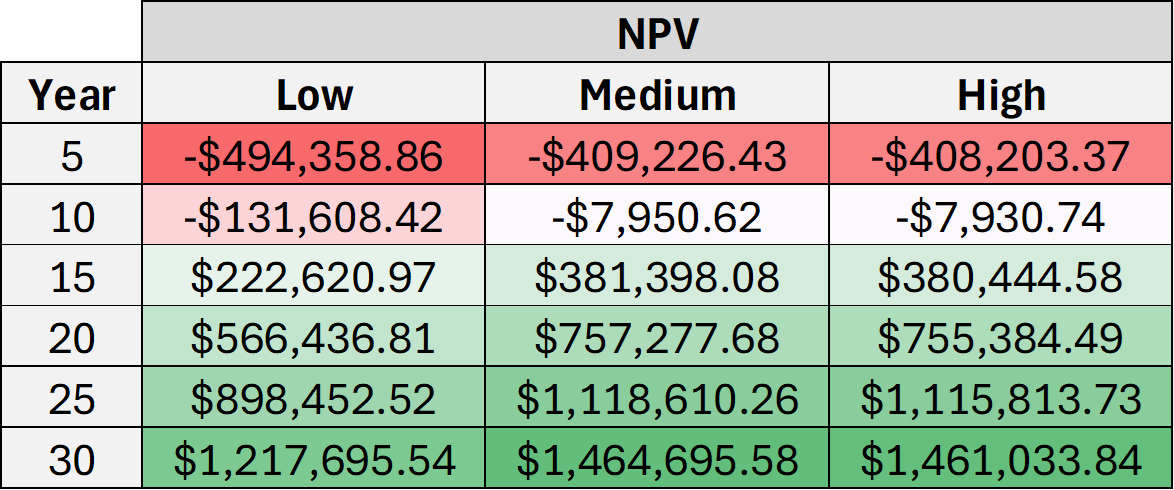
NPV data insights
Understand different scenarios for automated actionable data insights.


Net Present Value Excel Template: How to make better financial decisions.
Today’s fast paced environment requires us to make good decisions faster. We are overloaded with information, but somehow don’t have enough time to have enough information for us to feel comfortable with a decision. As a business owner, executive, or financial analyst, it can be challenging trying to make sound decisions with little time. The NPVDecisionHelper template is meant to help you organize the factors that go into your decisions to help you make sound investment choices.
I spent several years helping electric utilities create 20-30 years plans to help them decide what electricity generating resources to invest in for clean energy plans and growing demand. These projects are several $100 million each for a total investment decision of around $500 million. As you can imagine, it took careful analysis over many months to identify the right choices. This template boils down the method used to analyze these projects into a simple and easy formula to helps you calculate the costs, revenue, benefits and drawbacks of decisions. Then, it takes that information and displays it with helpful charts to help you understand the impacts.
What is NPV?
According to Investopedia, Net Present Value (NPV) is the difference between the present value of cash inflows and outflows. Calculating the NPV can be a helpful exercise to forecast investment costs and expected returns.
For example, let’s say you own a restaurant and want to add outdoor seating. The initial investment in outdoor seating will be $200,000. You expect adding outdoor seating will increase your revenue by an additional $7,000 per year. You discount the cash flows by 10% to account for inflation and your desired rate of return. You want to recoup your costs within 5 years. This scenario is described below:
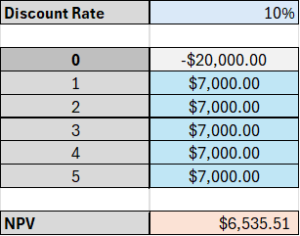
A positive NPV would tell you that in today’s dollars, the project will be profitable. A negative NPV would tell you that the project will be a loss.
In other words, with a positive NPV, go for it! With a negative NPV – maybe you need to think about how you can increase your forecasted revenue or cut down on your forecasted cost. Maybe you realize that you need to purchase cheaper outdoor furniture.
Standardizing decision making
If you are a busy executive, you don’t always have the time to get all the information you would like to make a decision. Maybe you have a bigger investment decision that needs careful financial analysis. Should we invest in this software? Should we add another location? Should we develop another product? These are all tough decisions that have long term financial and qualitative impacts. Using an Net Present Value Excel Template can help you calculate the risks and understand the impacts that guide these decisions.
Cautions
Understand that it is extremely hard to predict the future. Humans tend to be overconfident when forecasting revenue or expected outcomes. Two things can help us minimize the impacts of trying to predict the future.
1. Take the forecasts with a grain of salt. Understand that the forecast is just a forecast.
2. Look backwards to understand forwards. Some of the better forecasts look at historical data and forecast forwards. Try to get numbers that are grounded in reality.
3. Have several scenarios. For example, having a high, medium, and low scenario. Having a range of possible outcomes increases the chances of being correct. It is also helpful to understand where the edges are so you can prepare for such cases.
Taking a step back
Don’t forget to take a step back from the numbers and the decisions and try to understand the big picture. Use this tool as guide, not the truth. This should help you organize your thoughts and decisions so that you can bring better reasoning to your decisions. Go back to your goals and mission to understand if you should continue with the decision.
Using the NPVDecisionHelper Net Present Value Excel Template
Using the NPVDecisionHelper can help you outline your decisions. Customize to make it your own.
Do you have any ideas on how it can be improved? Let me know by clicking on the contact button above. Thank you!